Create Energy Table
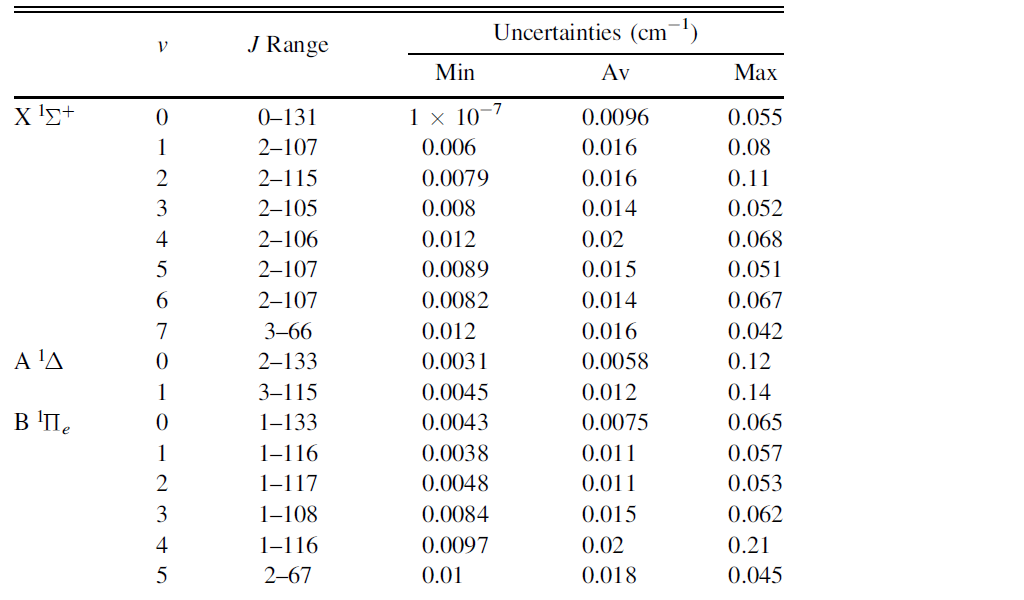
The aim of this algorithm is to create an energy table like you can see below:

Since the MARVEL is a general algorithm we don't know the quantum labels you use and their orders. Therefore you need to specify which quantum labels belong to each column. For larger molecule, one column might contain more than one quantum labels.
Step by step guide:
- Select the MARVEL energies file you want to process then press the "Load" button. The program will start processing the file, separating the energy level data (uncertainty, energy level, number of transitions) from the quantum labels. Note: the MARVEL energy file might contain the energies of other (floating) component(s), so if you would like to see only the data of largest component, remove the unnecessary energies.
- Use the dropdown-list(s) to declare a quantum labels to a column (for example, if Group 1 is 1 this means that the first quantum label identify the first column in the table).
- Use the "with" button to add a new quantum label (dropdown-list) to the group.
- You can display a range of quantum label values for a selected quantum label (at the bottom level groups) using the "Get range from:" checkbox and selecting a quantum label in the dropdown-list (note that: if all tags are assigned to groups the checkbox is not selectable).
- You can calculate the uncertainty statistics (min., max., average) for energy levels (at the bottom level groups) with the " Calculate unc. statistics" checkbox.
- You can count the number of energy levels in the bottom level groups with the " Show number of energy levels in groups" checkbox.
- You can get the min. and max. energy level values in the bottom level groups with the "Show range of energy levels in groups" checkbox.
For examples:
1. Let's suppose you work on the water molecule. The quantum lables are: v1 v2 v3 J Ka Kc, and you want to see a table where the first column contains the different VBOs and second column a range of J. In this case, you need create a group which contains the first three columns (using the 'With' button) and "Get range from:" and select column 4 and click 'Show table'.
2. If you work on a diatomic molecule where the quantum labels are: elec_state, vib, J. Group 1 should be 1, Group 2 should be 2, and "Get range from:" and select column 3 and click 'Show table'.